About the examples: Examples and screenshots in this guide use BEAT, a demo company in a Dynamics 365 test environment. Use your own company's codes and values instead of copying them.
Step by step, with screenshots
Set up Acceptance sampling chart1 screen
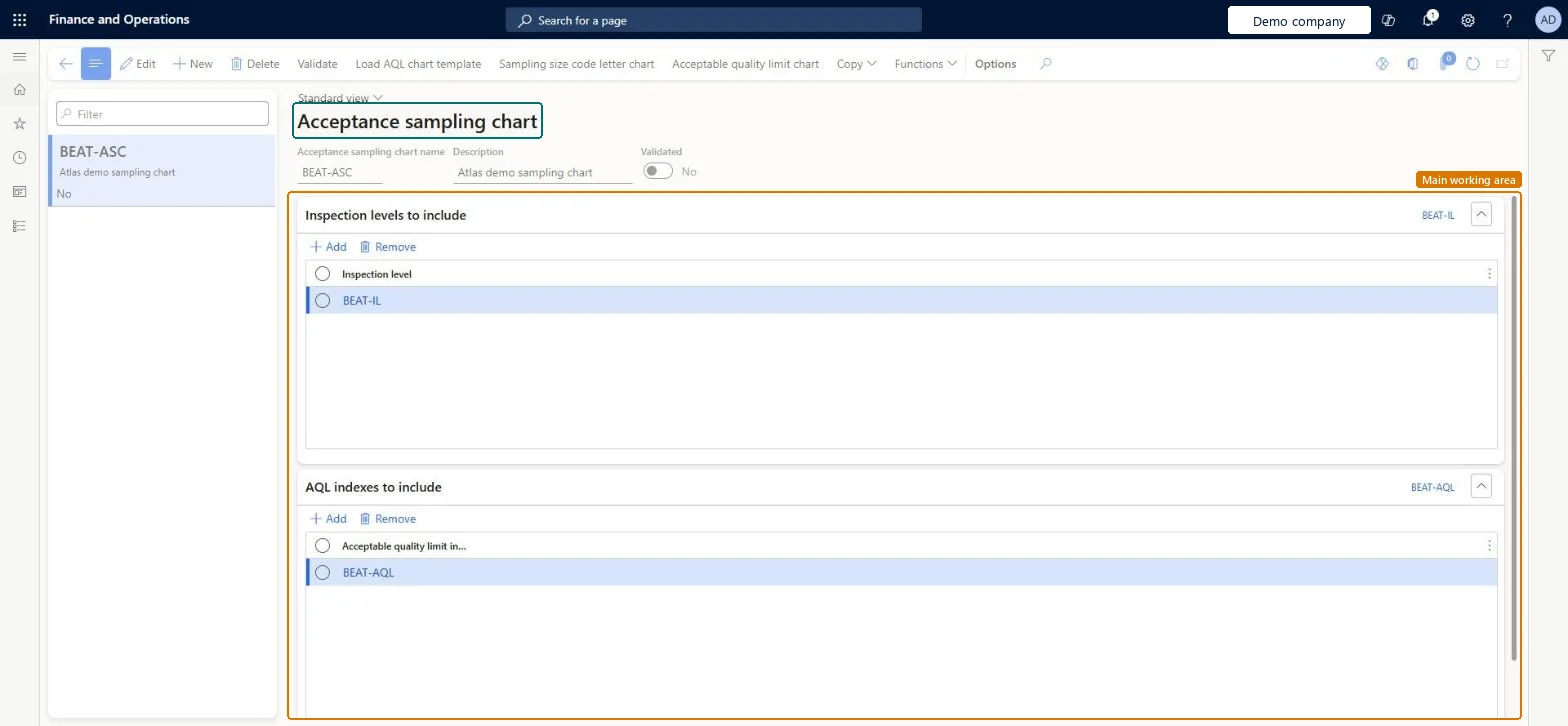
Use this page to work out the sample size and the number of defects allowed for a lot from its lot size, inspection level and AQL index.
Screen 1
Create an acceptance sampling chart
Go to Inventory management > Setup > Quality control > Acceptance sampling > Acceptance sampling chart
Make sure the inspection levels and AQL indexes exist (here demo level BEAT-IL and index BEAT-AQL), or use Load AQL chart template
Select New
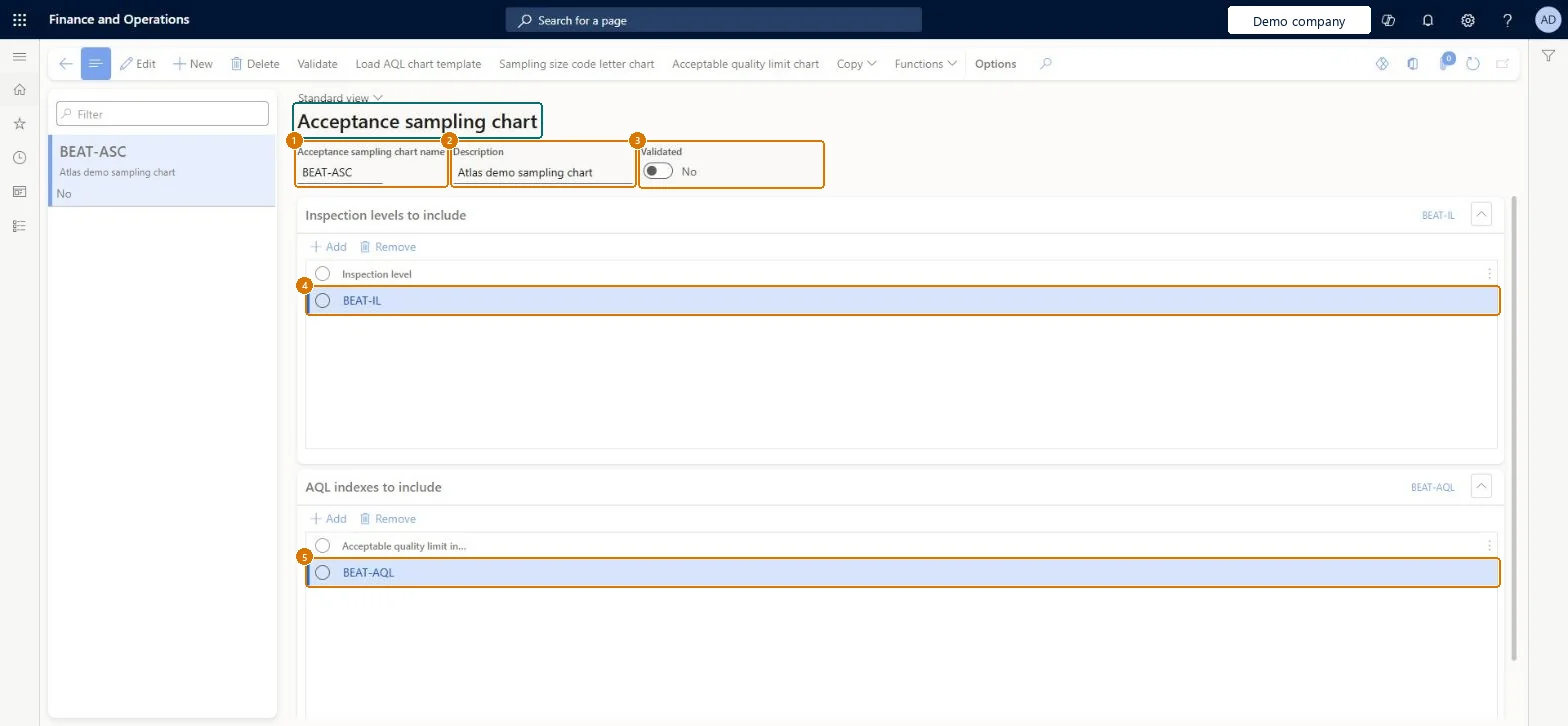
Enter the chart name and a description
Under Inspection levels to include, select Add and choose each inspection level
Under AQL indexes to include, select Add and choose each AQL index
Under Lot/batch size ranges, enter the lot size ranges, then fill in the sampling size code letter chart and acceptable quality limit chart
Select Save, then Validate when the chart is complete
1Acceptance sampling chart name
BEAT-ASC
2Description
Sampling chart
3Validated
No
4Inspection level
BEAT-IL
5Acceptable quality limit index
BEAT-AQL
Show the full screen page title tab to open what to set or check
Steps from Microsoft
Go to Inventory management > Setup > Quality control > Acceptance sampling > Acceptance sampling chart.
Add a new chart, or select one to edit.
Enter the Acceptance sampling chart name and a Description, and select Save.
Optionally, select Load AQL chart template or Copy to fill the chart quickly.
On the Inspection levels to include FastTab, add the inspection levels.
On the AQL indexes to include FastTab, add the AQL indexes.
On the Lot/batch size ranges FastTab, add the lot size ranges.
Select Validate to check the chart and make it usable.
Create a chart, select Load AQL chart template and then Validate; check Validated = Yes.
Open Acceptable quality limit chart and check code letter G with AQL 2.5 gives sample size 32 and accept 2.
Assign the chart to an item sampling record with Use acceptance sampling charts = Single and scope Order.
Trigger a quality order through a quality association and check the Acceptance sampling tab shows sample size, Target Ac and Target Re per defect category.
Load AQL chart template (aligned with ANSI/ASQ Z1.4 or ISO 2859-1), adjust as needed, then ValidateLearn provides the template so charts start from the standard tables, and only validated charts can be used for acceptance sampling.
Reversible: A validated chart is locked; Invalidate it to edit and validate again.
If you change it later
Once a chart is validated it's locked. To change it, select Invalidate, make the changes and validate it again. Microsoft Learn
Technical architect
6Technical
Menu item
QMSAQLChartChecked in Dynamics 365
Form
QMSAQLChartChecked in Dynamics 365
Table
QMSAQLChartShown as “Acceptance sampling charts” in Record infoChecked in Dynamics 365
Who can open it
PrivilegesMaintain AQL charts QMSAQLChartMaintainView AQL charts QMSAQLChartViewDutiesInquire into quality control master InventQualityControlMasterInquireEnable quality control process InventQualityControlProcessEnable2 security rolesQuality control clerk InventQualityControlClerkQuality control manager InventQualityControlManagerChecked in Dynamics 365
Roles to set it up and use it
To set it up or change itQuality control manager InventQualityControlManagerTo use itQuality control clerk InventQualityControlClerkGive people one of these roles. On this system, 2 roles can open this page.Checked in Dynamics 365
Actions on the page
Options: Personalize, Page options, ShareChecked in Dynamics 365
Checked in a working Dynamics 365 system, version 10.0.49: the menu item, form, table and security, the page, the demo records and the values in the screenshots.
To cite this step: IM-QC-220, Set up Acceptance sampling chart. Beyond ERP Atlas Hub, 2026-11-11. https://www.beyonderp.cloud/atlas/step/IM-QC-220