Sales and marketingInquiries and reportsSales performance analysis
SalesProfitabilityPerformancePowerBI
Used by
Chief executive officer, Sales manager
Business process
Measure sales performance
Menu item
SalesProfitabilityPerformancePowerBI
Setup steps
1 on this page
Show what matters for
PAGE GUIDEWhat the page does and how to use it8 sections. Choose a role to highlight what matters to you.
Everyone
1What it is and why
What it is
An analytics page with Power BI reports that sales managers use to monitor revenue, gross profit and profit margins.
What you do here
Use this page to follow changes in revenue and profit growth over time for customers and products.
Example
For example, BEAT's sales manager opens the page in November 2026: Top 10 customers by revenue shows BEAT-000123 first, and Customer profitability shows BEAT-000300 with high revenue but a gross margin of 9.00 percent, so its discount levels are reviewed.
The page in Dynamics 365. page title tab to open what to set or check
About the examples: Examples and screenshots in this guide use BEAT, a demo company in a Dynamics 365 test environment. Use your own company's codes and values instead of copying them.
Setup steps on this page
Review sales and profitability performance
Follow revenue, gross profit and margin trends by customer and product.
Steps from Microsoft
Go to Sales and marketing > Inquiries and reports > Sales performance analysis > Sales and profitability performance.
Check the report filters: by default the content shows the current calendar year; change the date or company filter if you review another period or legal entity.
Start on Revenue by customer and Revenue by product to see the leaders, then open Customer profitability to find customers with high revenue and a low gross margin.
Follow up the customers and products you found with the sales reports, for example Gross margin by customer.
Report page with the top 10 customers by revenue, revenue by customer group, total revenue, year-over-year growth and gross margin.Microsoft Learn
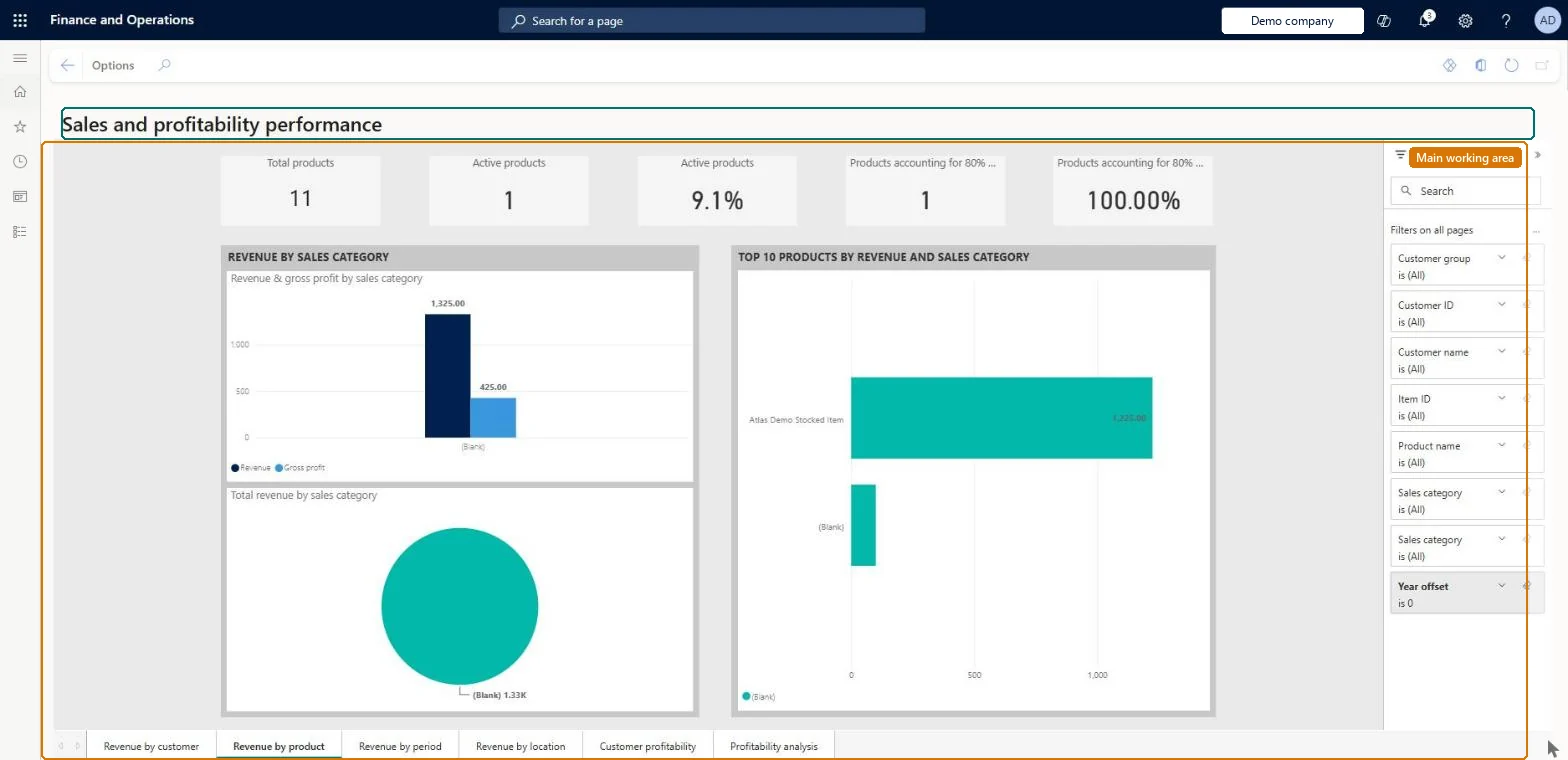
Revenue by product
Report page with revenue and gross profit by sales category and the top 10 products by revenue.Microsoft Learn
Revenue by period
Report page with revenue by month and year-over-year variance.Microsoft Learn
Customer profitability
Report page that plots each customer's gross margin against revenue.Microsoft Learn
BEAT-000300: high revenue, 9.00 percent margin
Profitability analysis
Report page with revenue and gross profit by month and the top 15 customers by gross margin.Microsoft Learn
Common errors and fixes
Message
What to do
The reports show no data or old data.
The content is filled from aggregate measurements staged in the Entity store; make sure the aggregate measurements are deployed and refreshed. Microsoft Learn
Test checklist
Open the page and set the date filter to last year.
Read Total revenue on Revenue by customer.
Check that it matches last year's invoiced revenue in the accounting currency for the same legal entity.
Set the date and company filters first; the default is the current calendar year.Year-to-date and year-over-year figures depend on the date filter; another company filter changes every chart.
On the live system, Sales manager and Chief executive officer use this page; 2 roles can open it in total. No Feature management feature is needed to open it.
Checked in Dynamics 365
Solution architect
5Design impact
Shared or per company
Company filter: the content covers the legal entities in its data and can be filtered by company, so one view can show several legal entities. Microsoft Learn
Can it be undone
Reversible: The page only reads analytics data; nothing is changed. Microsoft Learn
If you change it later
Revenue is the invoice line amount in the accounting currency; gross profit subtracts cost of goods sold, commission and included sales tax. Figures change only when the Entity store data is refreshed, not at the moment an invoice is posted. Microsoft Learn
Technical architect
6Technical
Menu item
SalesProfitabilityPerformancePowerBIChecked in Dynamics 365
Form
SalesProfitabilityPerformancePowerBIChecked in Dynamics 365
Who can open it
PrivilegesSales and profitability performance SalesProfitabilityPerformancePowerBIViewDutiesReview sales orders process performance SalesOrdersProcessPerformanceReview2 security rolesChief executive officer CompanyChiefExecutiveOfficerSales manager TradeSalesManagerChecked in Dynamics 365
Roles to set it up and use it
To use itSales manager TradeSalesManagerChief executive officer CompanyChiefExecutiveOfficerGive people one of these roles. On this system, 2 roles can open this page.Checked in Dynamics 365
Actions on the page
Options: Personalize, Page options, Share, Power BIChecked in Dynamics 365
Load order: Sales and profitability performance has no data entity in Data management. Its data comes from aggregate measurements of the Invoice lines entity staged in the Entity store, built from posted invoices and inventory transactions, so there is nothing to migrate to it.Microsoft Learn