Sales and marketingInquiries and reportsCustomer statistics
output:smmSalesCustItemStatistics
Business process
Measure sales performance
Menu item
output:smmSalesCustItemStatistics
Setup steps
1 on this page
Show what matters for
PAGE GUIDEWhat the page does and how to use it8 sections. Choose a role to highlight what matters to you.
Everyone
1What it is and why
What it is
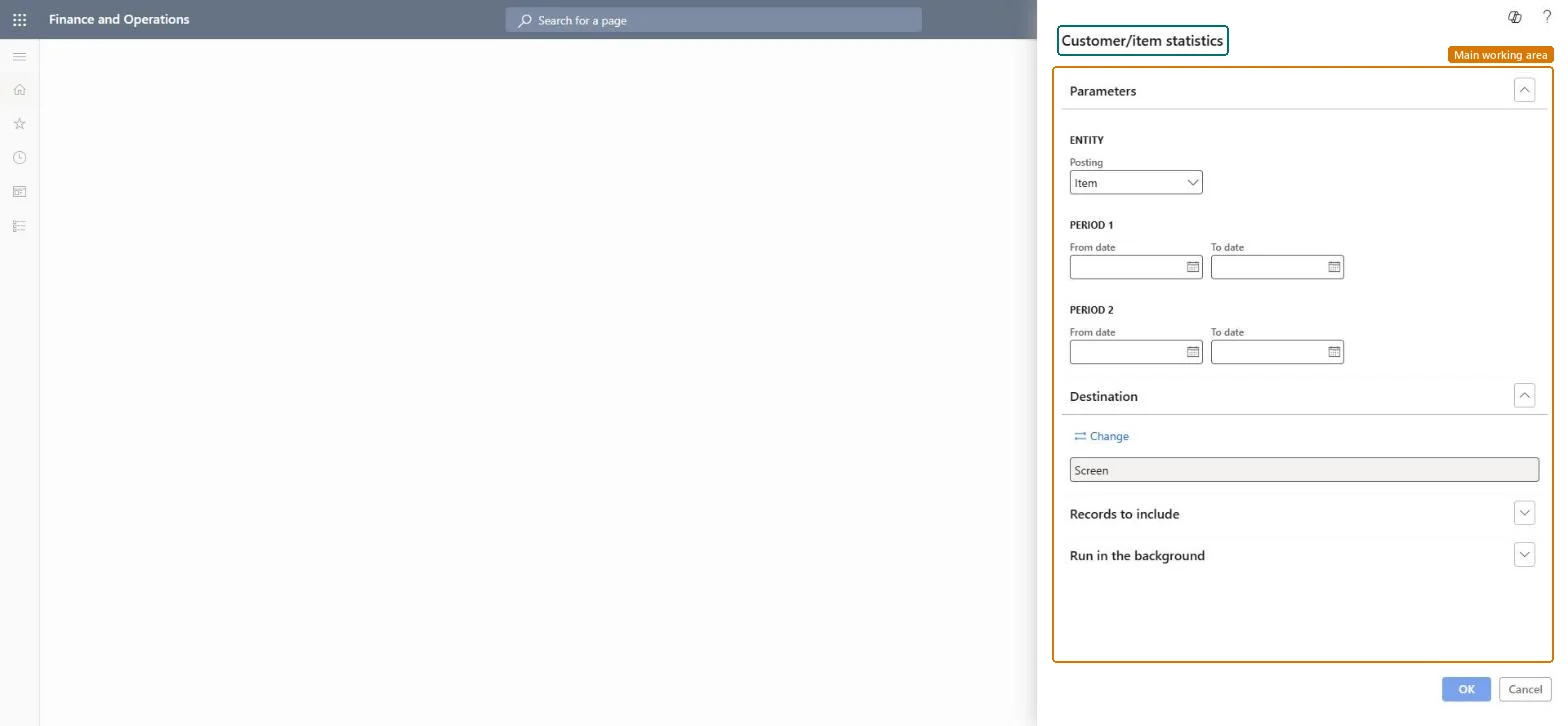
A report that shows sales per customer or per item for two periods side by side.
What you do here
Use it to compare sales between two periods, for example this quarter with the same quarter last year.
Example
For example, BEAT compares the third quarter of 2025 with the third quarter of 2026 per item: CHAIR-01 rose from 52,000.00 to 61,300.00, while DESK-02 fell from 40,000.00 to 22,800.00, which starts a talk with purchasing.
The page in Dynamics 365. page title tab to open what to set or check
About the examples: Examples and screenshots in this guide use BEAT, a demo company in a Dynamics 365 test environment. Use your own company's codes and values instead of copying them.
When to run it
When to run it
When you compare sales between two periods.
How often
On demand, usually at period end.
What the output shows
Sales per customer or per item for Period 1 and Period 2 side by side.
On the live system, Sales manager and Chief executive officer use this page; 2 roles can run it in total. No Feature management feature is needed to open it.
Checked in Dynamics 365
Solution architect
5Design impact
Shared or per company
Per company: the report reads the data of the legal entity you run it in. To compare legal entities, run it in each one. Checked in Dynamics 365
Can it be undone
Reversible: The report changes no data; it only reads sales data. Run it again with other parameters at any time. Checked in Dynamics 365
If you change it later
Amounts are read at run time; invoices posted later in a period change it on the next run. Year-over-year revenue change by customer region and sales category is also in the Sales and profitability performance Power BI content. Microsoft Learn
Technical architect
6Technical
Menu item
output:smmSalesCustItemStatisticsChecked in Dynamics 365
Form
SysOperationTemplateFormChecked in Dynamics 365
Roles to set it up and use it
To use itSales manager TradeSalesManagerChief executive officer CompanyChiefExecutiveOfficerGive people one of these roles. On this system, 2 roles can run this page.Checked in Dynamics 365
Load order: Customer/item statistics has no data entity in Data management. It is a report: it reads sales data and stores nothing of its own.Checked in Dynamics 365