A report of revenue, cost and gross margin, one row per project category, for two ledger date ranges side by side, built from posted project transactions. The report design is ProjProfitLossCateg2Prd.
Project management and accountingInquiries and reportsProfit and loss reports
output:ProjListProjProfitLossCategory2ColPeriod
Business process
Analyze project performance
Menu item
output:ProjListProjProfitLossCategory2ColPeriod
Setup steps
1 on this page
Show what matters for
PAGE GUIDEWhat the page does and how to use it8 sections. Choose a role to highlight what matters to you.
Everyone
1What it is and why
What it is
A report of revenue, cost and gross margin, one row per project category, for two ledger date ranges side by side, built from posted project transactions. The report design is ProjProfitLossCateg2Prd.
What you do here
It answers which project categories make or lose money, as a period-on-period comparison. On this system the Project manager, Project supervisor, CEO and CFO roles can run it; use it at month end to decide where to act on price, cost or scope.
Example
BEAT compares September and October 2026 in Category profit and loss (2 periods). HOURS-CONS earned a margin of 12,820.50 in September but only 2,211.00 in October, so the project manager reviews the October hours and the sales prices used.
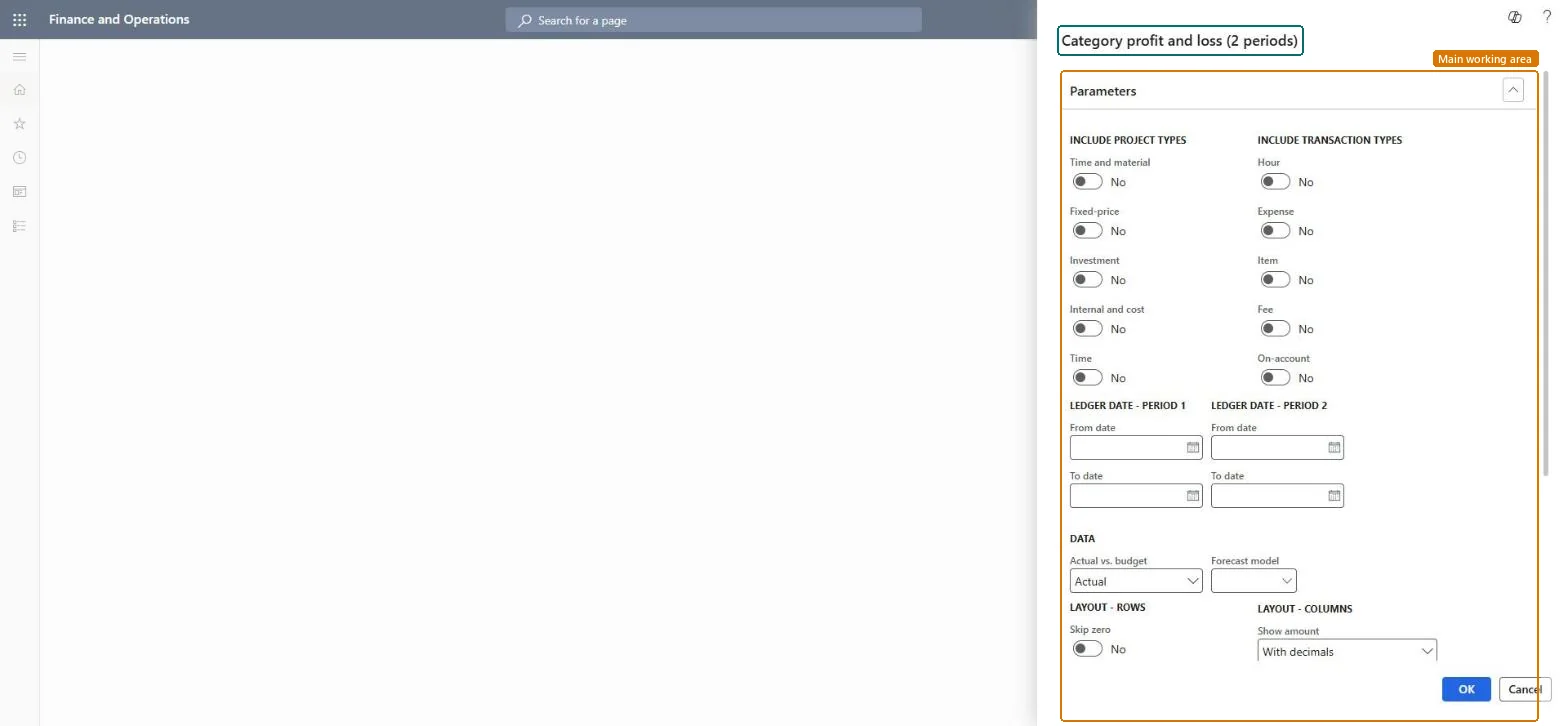
The page in Dynamics 365. page title tab to open what to set or check
About the examples: Examples and screenshots in this guide use BEAT, a demo company in a Dynamics 365 test environment. Use your own company's codes and values instead of copying them.
When to run it
When to run it
At month end, after costs are posted and revenue is accrued or invoiced, when you want to see how the figures moved from one period to the next.
How often
Monthly
Batch settings
Run it from the dialog for one review, or run it in the background on a monthly recurrence for the close pack.
What the output shows
Revenue, cost and gross margin, one row per project category, for period 1 and period 2 side by side. The report design is ProjProfitLossCateg2Prd.
Run the Category profit and loss (2 periods) report
Review revenue, cost and gross margin per project category for two ledger date ranges side by side.
Steps from Microsoft
Go to Project management and accounting > Inquiries and reports > Profit and loss reports > Category profit and loss (2 periods).
Turn on the project types and transaction types the project category figures should cover; for revenue and margin keep Time and material and Fixed-price on with all transaction types, because Time projects carry no ledger amounts.
Enter Ledger date - period 1 and Ledger date - period 2, for example September 2026 and October 2026, so the two profit and loss columns compare like with like.
Turn on Skip zero so categories with no amounts in the dates drop out, and keep the category list short enough to compare at a glance.
Read revenue, cost and gross margin on each project category row; a row with cost but no revenue usually means hours are posted but not yet accrued or invoiced.
Tie the total to Ledger reconciliation - profit and loss for the same dates, then follow up the project category with the weakest margin with its project manager.
Turn on each project type to include; at least one must be on. On this dialog the toggles are Time and material, Fixed-price, Investment, Internal and cost, and Time.Checked in Dynamics 365
Time and material and Fixed-price on
Include transaction types
Turn on each transaction type to include. On this dialog the toggles are Hour, Expense, Item, Fee and On-account.Checked in Dynamics 365
(Ledger date - period 1) From date / To date
The ledger date range shown in the period 1 column.Checked in Dynamics 365
1 September 2026 to 30 September 2026
(Ledger date - period 2) From date / To date
The ledger date range shown in the period 2 column.Checked in Dynamics 365
1 October 2026 to 31 October 2026
Forecast model
The forecast model that holds the budget figures. With project budget control, pick the original or remaining budget forecast model that the project's budget uses.Microsoft Learn
BUD-ORIG
Actual vs. budget
Actual (the default) shows posted figures; Budget shows the amounts in the chosen forecast model.Checked in Dynamics 365
Actual
Skip blank ID
Leaves out lines that have no project category ID.Checked in Dynamics 365
Skip zero
Leaves out rows where every amount is zero.Checked in Dynamics 365
Yes
Show amount
How amounts are printed: With decimals (the default), without decimals, or in thousands or millions.Checked in Dynamics 365
With decimals
Show hour
Whether hour lines show the number of hours, their cost value or both.Checked in Dynamics 365
Common errors and fixes
Message
What to do
A project category shows cost but no revenue for the dates.
For Time and material projects, revenue appears when it is accrued or invoiced; run Accrue revenue or post the invoice, then rerun the report. Microsoft Learn
The period 2 column is empty although work was done.
Ledger date ranges only pick up transactions that are posted to the ledger; post the open journals and timesheets for period 2, then rerun. Checked in Dynamics 365
Test checklist
Run Category profit and loss (2 periods) for BEAT for October 2026 with HOURS-CONS in the data.
Open the project's statement for the same dates and project types.
Check that revenue and cost on the HOURS-CONS row match the statement to the cent.
Set both ledger date ranges to complete periods of the same length first, then the project and transaction types.Unequal or open periods make one column look better or worse for reasons that are only about the calendar.
On the live system, Project manager, Project supervisor, Chief executive officer and Chief financial officer can run this report.
Checked in Dynamics 365
Solution architect
5Design impact
Shared or per company
Per legal entity: the report reads the projects, transactions and setup of the company you run it in. Run it in each company to compare them. Checked in Dynamics 365
Can it be undone
Reversible: Reversible: the report changes no data. Checked in Dynamics 365
If you change it later
Rerun after Post costs, Accrue revenue, invoice posting or adjustments; the figures change as soon as new transactions are posted for the dates. The report itself changes nothing downstream. Microsoft Learn
Technical architect
6Technical
Menu item
output:ProjListProjProfitLossCategory2ColPeriodChecked in Dynamics 365
Form
SysOperationTemplateFormChecked in Dynamics 365
Roles to set it up and use it
To use itProject manager ProjProjectManagerProject supervisor ProjProjectSupervisorChief executive officer CompanyChiefExecutiveOfficerChief financial officer CompanyChiefFinancialOfficerGive people one of these roles. On this system, 4 roles can run this page.Checked in Dynamics 365
Load order: Category profit and loss (2 periods) has no data entity in Data management: it is a report. Move the project transactions, timesheets and forecasts it reads, and the report shows them when it runs.Checked in Dynamics 365