Plan inbound transportation loads in Dynamics 365 Supply Chain Management
Show what matters for
PAGE GUIDEWhat the page does and how to use it6 sections. Choose a role to highlight what matters to you.
Everyone
1What it is and why
What it is
A report that compares estimated and actual times for the activities in voyage journeys, grouped by service provider.
What you do here
Use this report to review how accurate your lead-time estimates are for each provider, such as a shipping company or customs broker, across the voyages you have tracked.
Example
For example, compare estimated and actual days by provider to see which shipping company most often takes longer than the lead time set in the tracking control center.
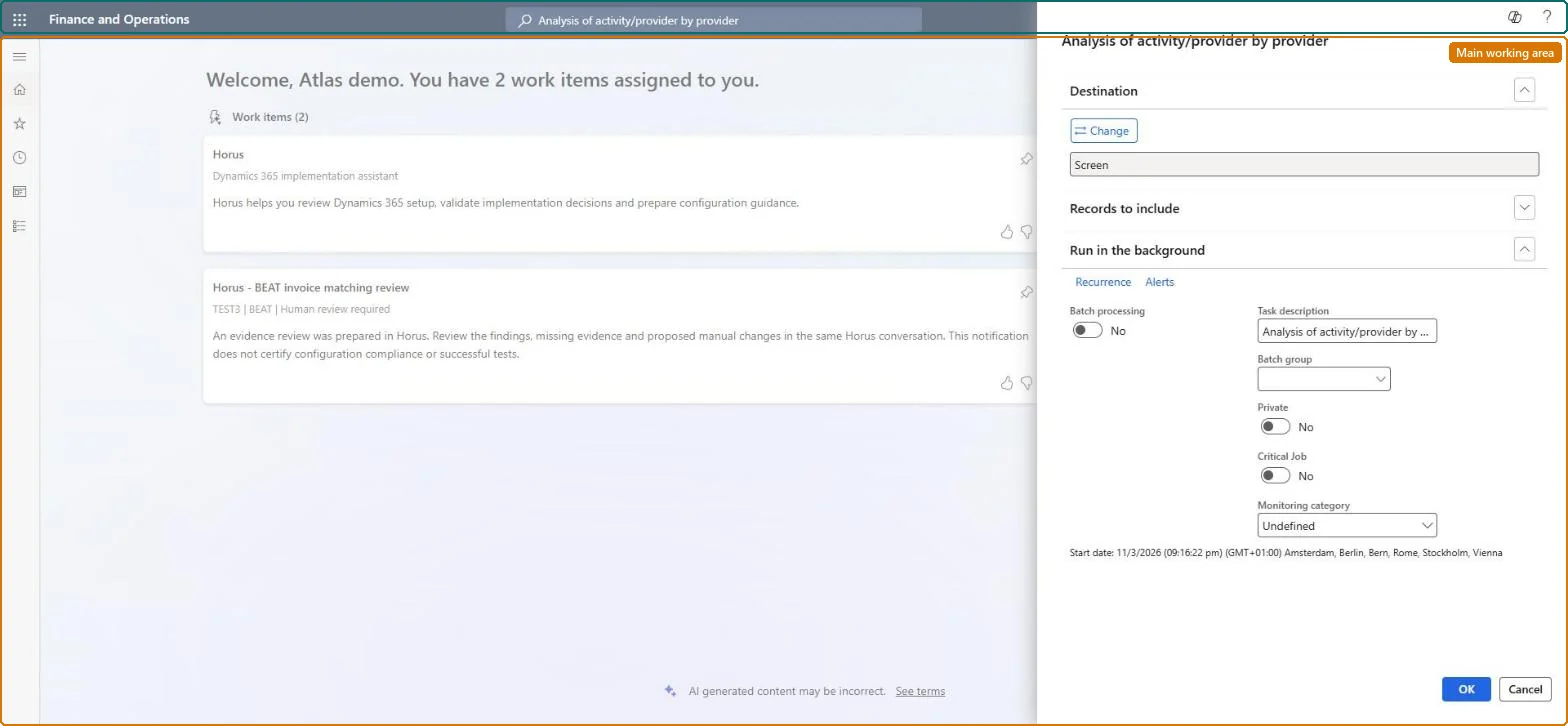
The page in Dynamics 365. page title tab to open what to set or check
About the examples: Examples and screenshots in this guide use BEAT, a demo company in a Dynamics 365 test environment. Use your own company's codes and values instead of copying them.
When to run it
When to run it
When you assess how reliable each shipping company, freight forwarder or broker is against the times you planned for them.
How often
On demand, for example before you renegotiate with a provider or plan the next season's voyages.
What the output shows
Estimated and actual times for the voyage activities, grouped by provider. A provider that is late on most voyages shows a consistent gap; a single outlier usually comes from one voyage with a missing or wrong actual date.
Go to Landed cost > Reports > Analysis of activity/provider by provider.
Use this version when you want the estimated and actual times grouped by service provider, such as a shipping company or customs broker. For one group per activity, run Analysis of activity/provider by activity instead.
Make sure the container activities of the voyages you want to compare have their actual end dates, so each provider is measured on real completion dates.
On Records to include, limit the report to the providers or voyages you want to assess, then select OK.
Compare providers: one whose actual times are often later than the estimate is a reason to revisit the lead times you plan for that provider.