About the examples: Examples and screenshots in this guide use BEAT, a demo company in a Dynamics 365 test environment. Use your own company's codes and values instead of copying them.
Steps from Microsoft
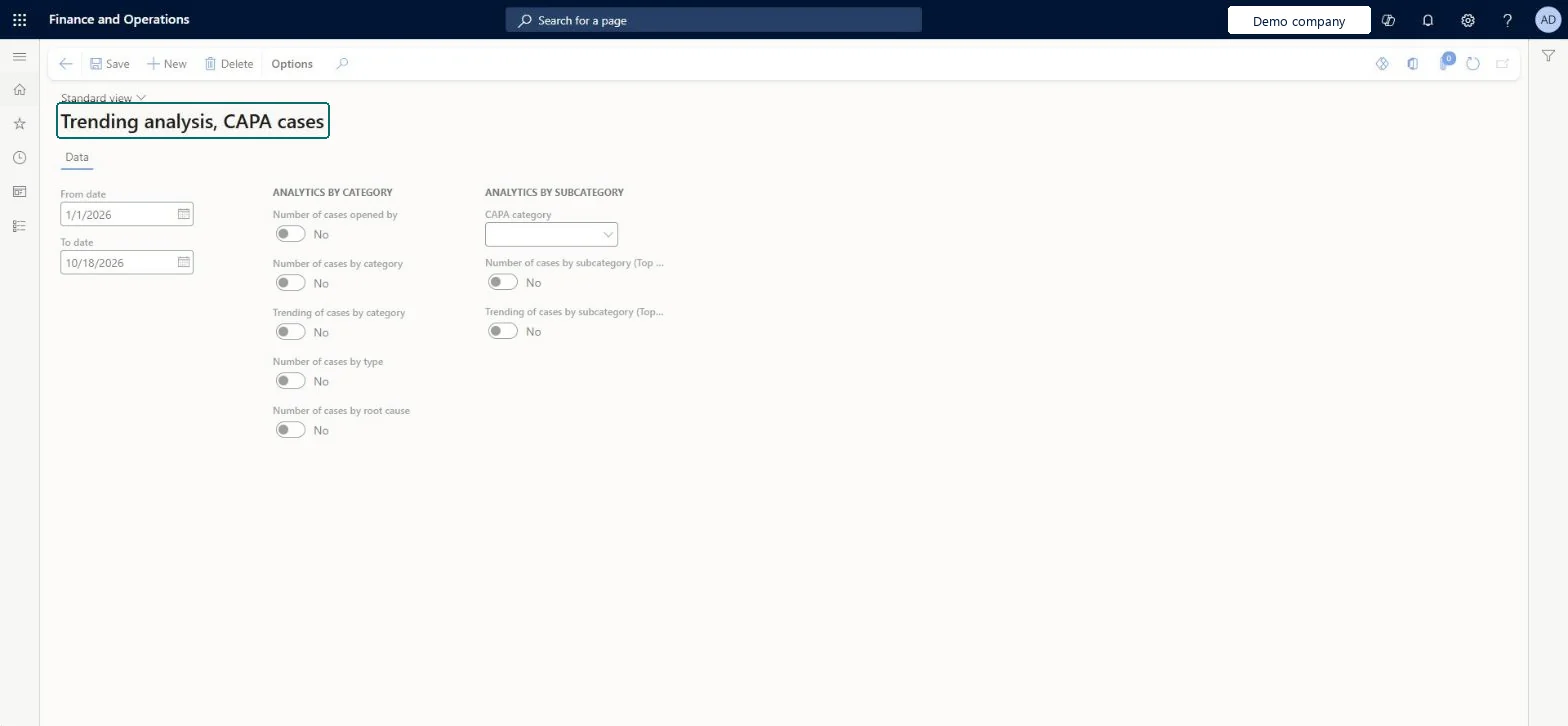
Go to Inventory management > Inquiries and reports > CAPA management > Trending analysis.
On the Data tab, select the date range and turn on each chart that you want to see.
Select the Analytics by category tab to view the charts.
Use the buttons above each chart to switch its style, for example to a bar, line or pie chart.
GraphicsTmpDataShown as “Graphics” in Record infoChecked in Dynamics 365
Who can open it
PrivilegesView CAPA analytics for CAPA specific cases QMSCAPAAnalyticsViewDutiesInquire into analytics for CAPA cases QMSCAPAAnalyticsInquire2 security rolesCAPA administrator QMSCAPAAdministratorCAPA updater QMSCAPAUpdaterChecked in Dynamics 365
Roles to set it up and use it
To use itCAPA updater QMSCAPAUpdaterCAPA administrator QMSCAPAAdministratorGive people one of these roles. On this system, 2 roles can open this page.Checked in Dynamics 365
Actions on the page
Options: Personalize, Page options, Edit, ShareChecked in Dynamics 365