BeyondERP.Newsletter
Menu

Report page · Retail and Commerce

Catalog area analysis report

A report dialog that analyses sales against a printed catalog by the share of page space and page cost each product had (a square inch analysis).

Business process
Develop call center catalogs in Dynamics 365 Commerce
Menu item
RetailCatalogAreaAnalysis
Show what matters for
PAGE GUIDEWhat the page does and how to use it7 sections. Choose a role to highlight what matters to you.
Everyone

1What it is and why

What it isA report dialog that analyses sales against a printed catalog by the share of page space and page cost each product had (a square inch analysis).
What you do hereUse this page to check whether catalog page space is earning enough sales and profit for its cost.
ExampleFor example, a catalog manager can compare each product's space cost with the profit it brought in, to plan the next catalog layout.
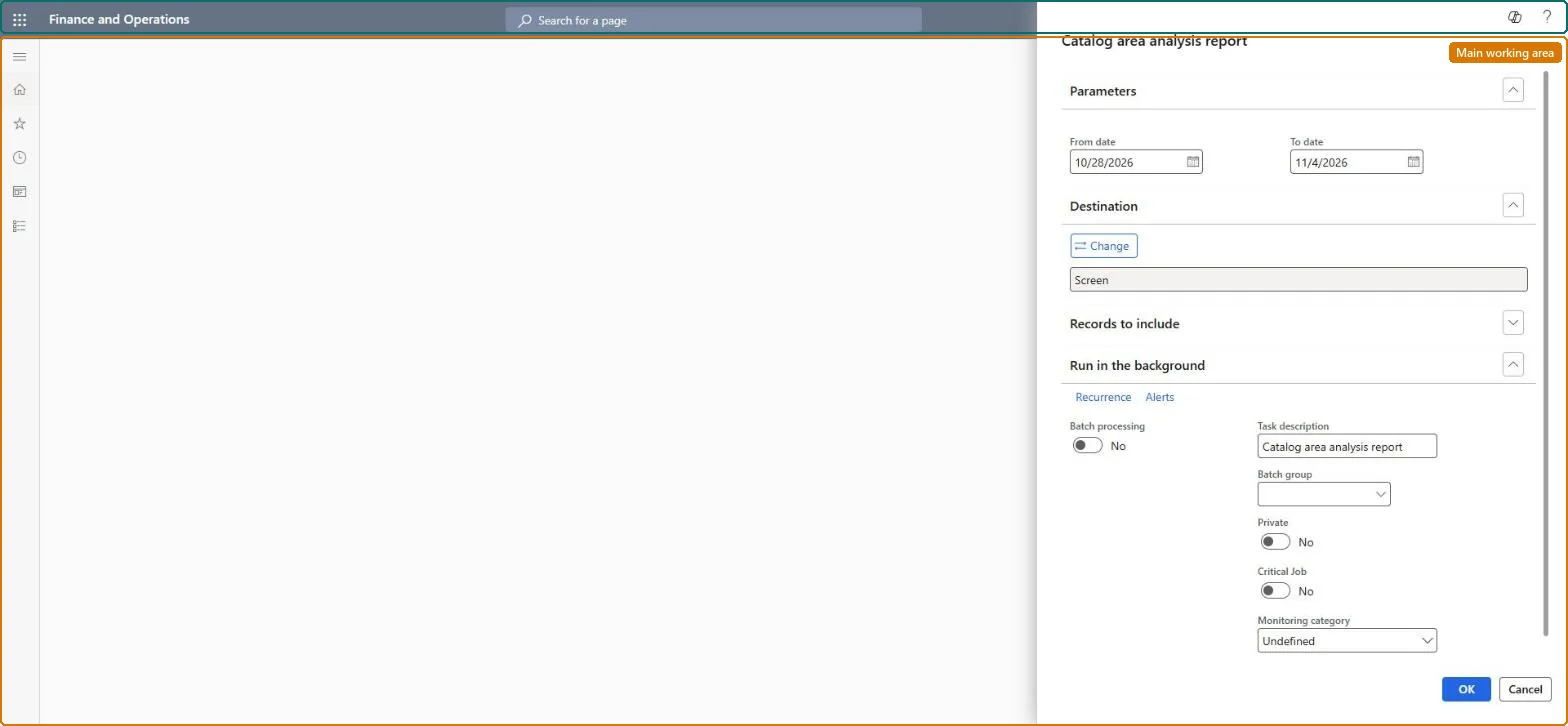
Catalog area analysis report page in Dynamics 365
The page in Dynamics 365. page title tab to open what to set or check
Functional consultant · Solution architect

2Where it fits

Business processDevelop sales policies › Develop sales catalogs › Develop call center catalogs in Dynamics 365 Commerce
Menu pathRetail and Commerce › Inquiries and reports › Call center reports › Catalog area analysis report
Set up firstAll catalogs (Catalog pages, Product page layout) Microsoft Learn
End user · Functional consultant

3How to do it

About the examples: Examples and screenshots in this guide use BEAT, a demo company in a Dynamics 365 test environment. Use your own company's codes and values instead of copying them.

When to run it

When to run itAfter a printed catalog has been in the market long enough to collect orders against its source code.
How oftenOn demand, for example at the end of each catalog's life or before you plan the next catalog.
Batch settingsRun it in the background for a large catalog or a long date range.
What the output showsA square inch analysis per product: Space cost (cost per page times the product's share of the page), sales against the catalog and Contribution to profit (sales minus space cost). Zero sales for a product usually means the orders were taken without the catalog's source code ID.

Source: Microsoft Learn

Steps from Microsoft

  1. Go to Retail and Commerce > Inquiries and reports > Call center reports > Catalog area analysis report.
  2. Make sure the catalog has Catalog pages and the Product page layout set up: the report needs the page, share of the page and page cost for each product.
  3. Enter the From date and To date of the sales orders to analyze. Only orders that carry the catalog's source code ID count as catalog sales.
  4. Print the report and compare the Space cost with the sales of each product.
  5. Look at Contribution to profit: products whose sales don't cover their space cost are candidates for less page space in the next catalog.
Source: Microsoft Learn

Fields on the page

FieldWhat it means
Space costThe cost of the page space given to the product (cost per page times the share of the page).Microsoft Learn
Contribution to profitThe product's sales minus its space cost.Microsoft Learn
Solution architect

4Design impact

Can it be undoneNothing to undo: The report only analyzes catalog sales; nothing is changed. Microsoft Learn
Technical architect

5Technical

Menu itemRetailCatalogAreaAnalysis Checked in Dynamics 365
FormSysOperationTemplateForm Checked in Dynamics 365
Developer

6Developer

Open it by URLhttps://<your-environment>/?mi=RetailCatalogAreaAnalysis
Everyone

7Sources