PAGE GUIDEWhat the page does and how to use it8 sections. Choose a role to highlight what matters to you.
Everyone
1What it is and why
What it is
A report that gives an overview of questionnaire results for each questionnaire.
What you do here
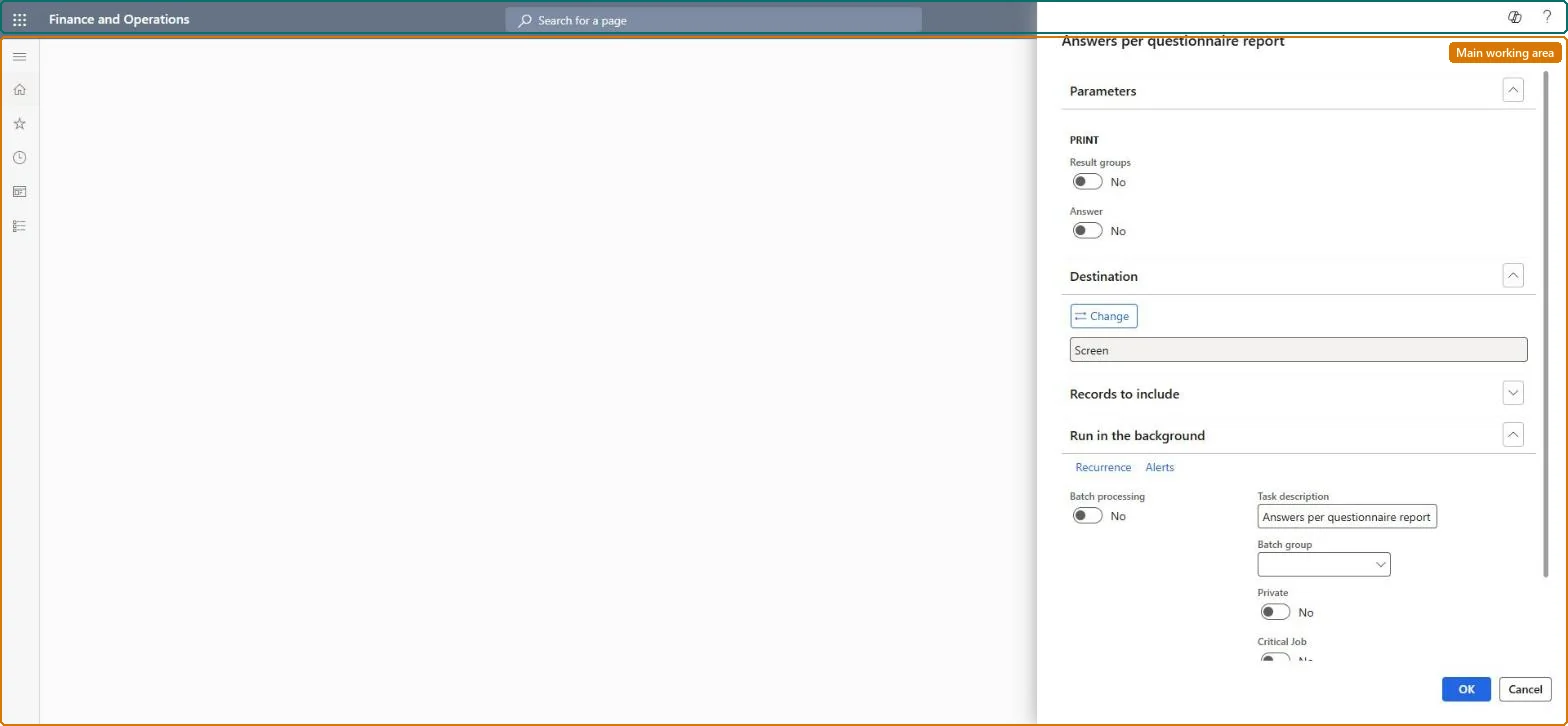
Use this page to print results per questionnaire, optionally with a points and percentage summary for each result group and the question and answer text.
Example
For example, BEAT compares its two course evaluations COURSE-A and COURSE-B: with Result groups on, the report shows Instructor at 82 percent on A and 64 percent on B.
The page in Dynamics 365. page title tab to open what to set or check
About the examples: Examples and screenshots in this guide use BEAT, a demo company in a Dynamics 365 test environment. Use your own company's codes and values instead of copying them.
When to run it
When to run it
When you compare results questionnaire by questionnaire, for example scores of a course evaluation.
How often
On demand, at the end of each survey or test.
What the output shows
Results grouped per questionnaire, with result group summaries and, optionally, every answer and its points. Low points in one result group point to the topic that needs attention.
Use this page to print results per questionnaire, optionally with a points and percentage summary for each result group and the question and answer text.
Steps from Microsoft
Go to Questionnaire > View and analyze results > Answers per questionnaire report.
In Parameters, under Print, turn on Result groups to get a points and percentage summary for each result group per questionnaire.
Turn on Answer to print questions and answers with points per answer; with it off, only the answer session status is printed.
In Records to include, choose the questionnaires, run the report and compare the results between questionnaires.
Prints a summary for each result group for each questionnaire.Microsoft Learn
Yes
Answer
Prints the question and answer text with points per answer; when cleared, prints only the answer session status.Microsoft Learn
Yes
Common errors and fixes
Message
What to do
Fewer answers print than were given
Only completed answer sessions are printed; sessions that were cancelled or are still planned don't appear. Microsoft Learn
A result group shows no points
Result groups only count closed-ended questions (input type Check box, Alternative button or Combo box) whose answer group has Points on its answers. Microsoft Learn
Turn on Result groups for the points and percentage per group; add Answer only when you need every answer.Result-group summaries compare questionnaires at a glance; Answer prints every answer and its points, which is long.
No Feature management feature is needed for questionnaires; Microsoft Learn describes them without one. Questionnaires belong to the Human resources area, and in this system the same pages are also granted through procurement (vendor and RFQ questionnaires), sales and marketing (campaigns, telemarketing) and case management duties, as the Security section shows. The survey owner, trainer or recruiter prints it.
Prints results per questionnaire, with result-group summaries (points and percentage) and, if selected, every question, answer and points. Microsoft Learn
Can it be undone
Nothing to undo: The report only reads answers; it changes nothing. Microsoft Learn
If you change it later
None on data. It reads answer sessions, so run it before Delete results removes them. Microsoft Learn
Technical architect
6Technical
Menu item
KMKnowledgeCollectorResultByCollectionChecked in Dynamics 365
Form
SysOperationTemplateFormChecked in Dynamics 365
Roles to set it up and use it
To use itHuman resource assistant HcmHumanResourceAssistantMarketing manager CRMMarketingManagerPurchasing manager TradePurchasingManagerSales manager TradeSalesManagerHuman resource manager HcmHumanResourceManagerGive people one of these roles. On this system, 18 roles can run this page.Checked in Dynamics 365
Load order: The Answers per questionnaire report has no data entity in Data management, so it can't be loaded from a file or a configuration template. It is a report: it reads answer sessions and result groups and holds no data of its own, so there is nothing to migrate.Checked in Dynamics 365