PAGE GUIDEWhat the page does and how to use it8 sections. Choose a role to highlight what matters to you.
Everyone
1What it is and why
What it is
A report that shows expense amounts grouped by cost group.
What you do here
Use this report to see expense totals per statistics group, filtered by expense report number and statistics group.
Example
For example, travel, accommodation and meals categories are linked to the statistics group TRAVEL; the report shows TRAVEL at 54,000.00 USD for the year, without listing each category.
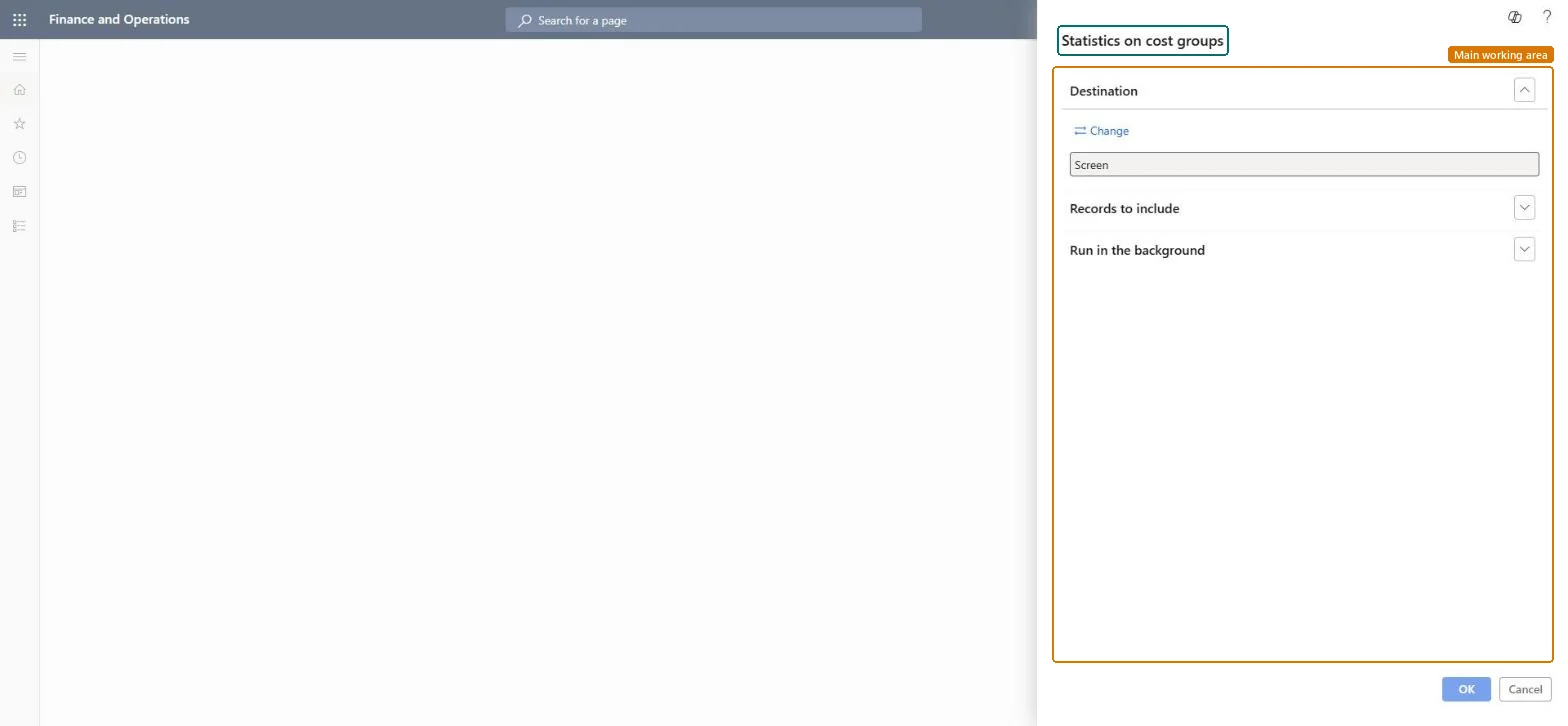
The page in Dynamics 365. page title tab to open what to set or check
About the examples: Examples and screenshots in this guide use BEAT, a demo company in a Dynamics 365 test environment. Use your own company's codes and values instead of copying them.
When to run it
When to run it
When management wants expense totals per cost group rather than per employee or category.
How often
On demand, for example in monthly cost reviews.
What the output shows
Expense amounts totaled per statistics group. Amounts in an unexpected group usually mean the expense category is linked to the wrong statistics group.
Define a few broad groups (travel, entertainment, training) and link every expense category to one.The report totals cost per statistics group, so a category with no group is left out of the totals.
In this system Employee and Contractor enter their own expenses, and Expense administrator sets up the module and processes documents. The expense mobile app needs the Employee role, a company on the user account and a link to an employee with active employment. The expense administrator runs this report; no Feature management feature is needed.
Load order: The report has no data entity in Data management, so it can't be loaded from a file or a configuration template. It reads posted or entered expense data and prints it; nothing on it is loaded or migrated. Run it in each environment after the data is there.Microsoft Learn