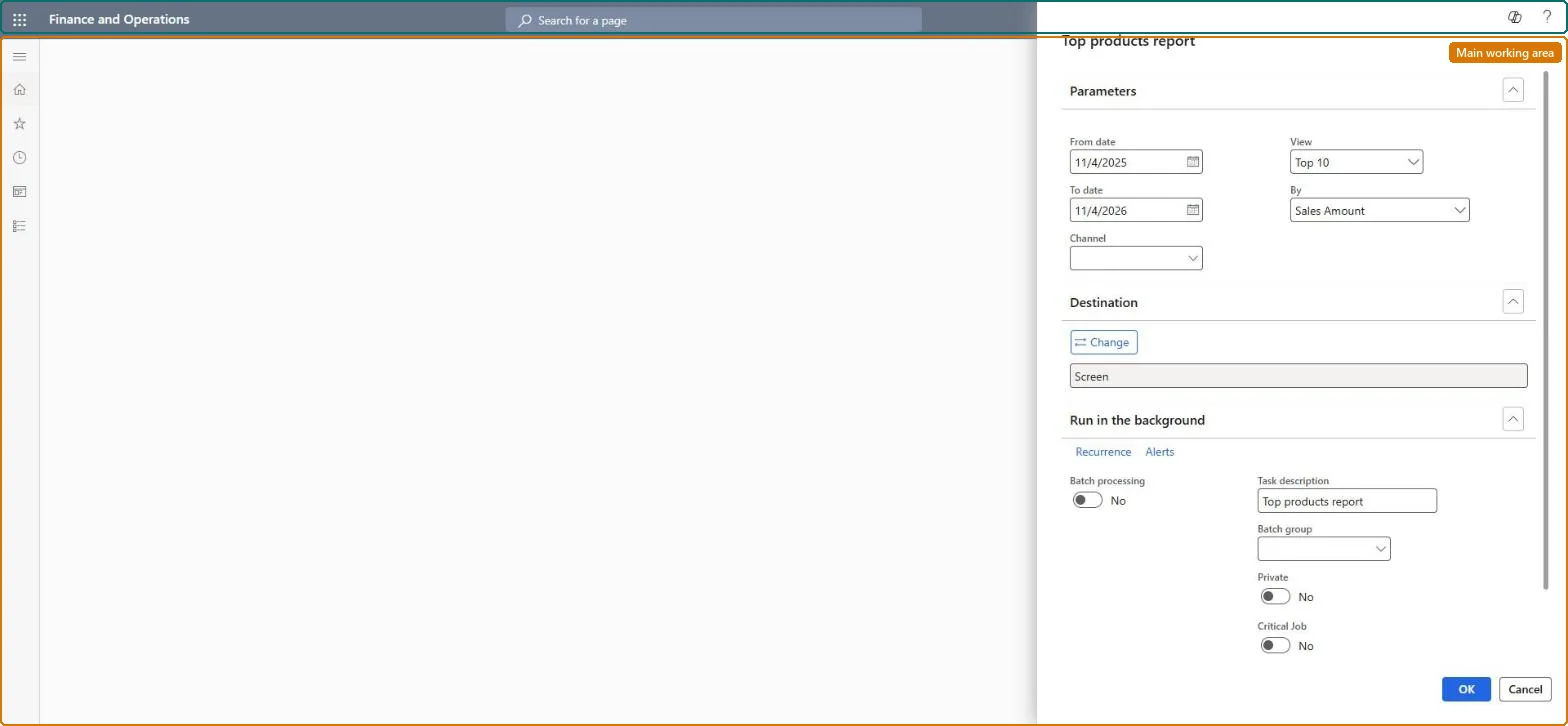
About the examples: Examples and screenshots in this guide use BEAT, a demo company in a Dynamics 365 test environment. Use your own company's codes and values instead of copying them.
When to run it
When to run it
When you want to know which products sell best, or are most profitable, in a channel for a period.
How often
On demand, for example at the end of a sales period or promotion.
What the output shows
Sales metrics for the top N products (10 to 100) of the channel, ranked by the measure you choose. A product missing from the list may simply rank lower on the chosen measure, or its sales haven't been posted from the store yet.
Go to Retail and Commerce > Inquiries and reports > Sales reports > Top products report.
In the From date and To date fields, enter the period you want to rank products for.
In the Channel field, select the channel or operating unit whose products you want to rank.
Run the report and choose the measure to rank by: sales amount, quantity, gross profit margin or margin percentage. It shows the top 10 to 100 products.
Nothing to undo: The top products report only reads sales data; it changes nothing. Microsoft Learn
Technical architect
5Technical
Menu item
RetailTopProductsSSRSReportChecked in Dynamics 365
Form
SysOperationTemplateFormChecked in Dynamics 365
Roles to set it up and use it
To use itRetail service RetailServiceRetail operations manager RetailOperationsManagerRetail store manager RetailStoreManagerRetail merchandising manager RetailMerchandisingManagerGive people one of these roles. On this system, 4 roles can run this page.Checked in Dynamics 365