BeyondERP.Newsletter
Menu

Report page · Retail and Commerce

Organization sales report

A report dialog that prints store performance by organization unit, with sales quantity, amount and profit margin per store.

Business process
Analyze and monitor Point of Sale (POS) activity in Dynamics 365 Commerce
Menu item
RetailStoreMetricsSSRSReport
Show what matters for
PAGE GUIDEWhat the page does and how to use it7 sections. Choose a role to highlight what matters to you.
Everyone

1What it is and why

What it isA report dialog that prints store performance by organization unit, with sales quantity, amount and profit margin per store.
What you do hereUse this page to compare sales and margin for stores grouped by the default reporting hierarchy.
ExampleFor example, a regional manager can compare sales and margin for all stores in a region for a month.
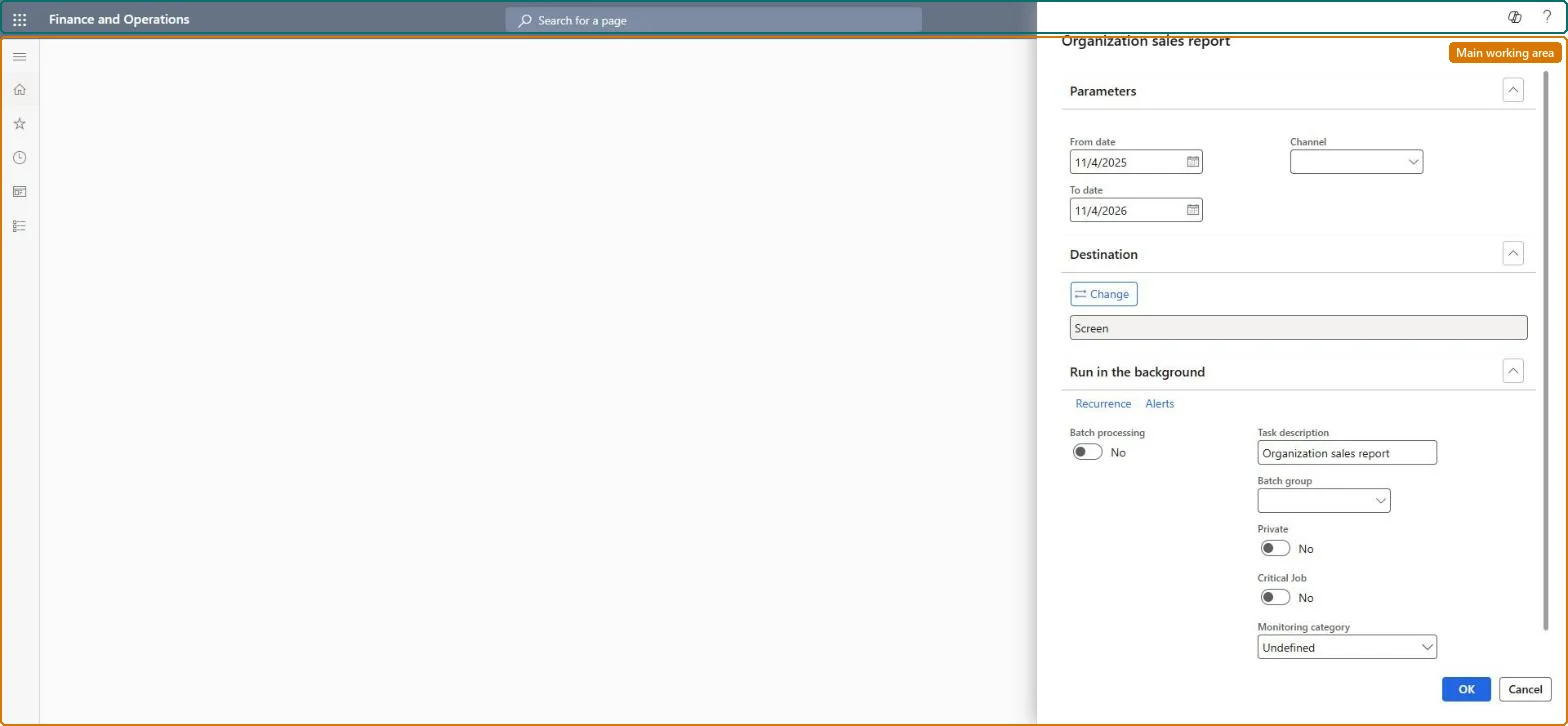
Organization sales report page in Dynamics 365
The page in Dynamics 365. page title tab to open what to set or check
Functional consultant · Solution architect

2Where it fits

Business processAnalyze sales performance › Measure sales performance › Analyze and monitor Point of Sale (POS) activity in Dynamics 365 Commerce
Menu pathRetail and Commerce › Inquiries and reports › Sales reports › Organization sales report
Set up firstOrganization hierarchies (default reporting hierarchy) Microsoft Learn
Related pagesStore management workspace reports Microsoft Learn
End user · Functional consultant

3How to do it

About the examples: Examples and screenshots in this guide use BEAT, a demo company in a Dynamics 365 test environment. Use your own company's codes and values instead of copying them.

When to run it

When to run itWhen you compare sales and margin across stores and regions of your organization.
How oftenOn demand, for example monthly store reviews.
What the output showsSales quantity, sales amount and profit margin per store, grouped by the default reporting hierarchy. Stores in an unexpected group usually mean the default reporting hierarchy is a different one than you thought.

Source: Microsoft Learn

Steps from Microsoft

  1. Go to Retail and Commerce > Inquiries and reports > Sales reports > Organization sales report.
  2. Enter the From date and To date of the period whose store sales you want to compare.
  3. Check which organization hierarchy is set as the default for reporting; the report groups stores by it.
  4. Run the report and drill down from the top operating unit to the individual stores.

Source: Microsoft Learn

Fields on the page

FieldWhat it means
From dateThe first date of the period the report covers.Microsoft Learn
To dateThe last date of the period the report covers.Microsoft Learn
Solution architect

4Design impact

Can it be undoneNothing to undo: The organization sales report only reads data; it changes nothing. Microsoft Learn
If you change it laterThe report groups stores by the organization hierarchy set as the default for reporting, so changing that hierarchy changes how the report groups stores. Microsoft Learn
Technical architect

5Technical

Menu itemRetailStoreMetricsSSRSReport Checked in Dynamics 365
FormSysOperationTemplateForm Checked in Dynamics 365
Roles to set it up and use itTo use itRetail service RetailServiceRetail operations manager RetailOperationsManagerRetail store manager RetailStoreManagerGive people one of these roles. On this system, 3 roles can run this page.Checked in Dynamics 365
Developer

6Developer

Open it by URLhttps://<your-environment>/?mi=RetailStoreMetricsSSRSReport
Everyone

7Sources