Production controlInquiries and reportsCost analysis reports
output:ProdCalcTrans
Business process
Cost variance analysis in Dynamics 365 Supply Chain Management
Menu item
output:ProdCalcTrans
Show what matters for
PAGE GUIDEWhat the page does and how to use it7 sections. Choose a role to highlight what matters to you.
Everyone
1What it is and why
What it is
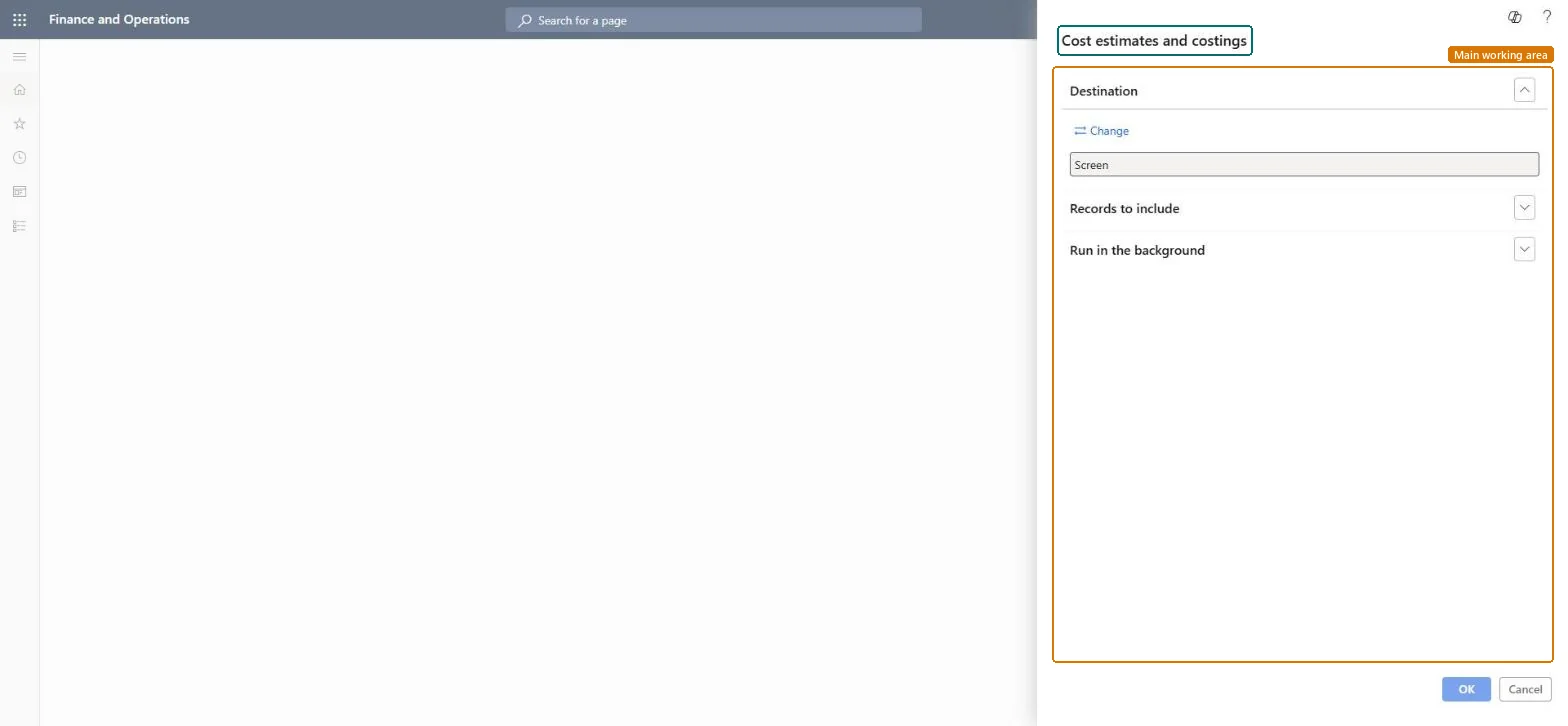
A report that shows the estimated costs and actual costs of production orders.
What you do here
Use this report to analyse the estimated and actual costs and quantities for each component item, routing operation and indirect cost, and to predict variances before you end a production order.
The page in Dynamics 365. page title tab to open what to set or check
About the examples: Examples and screenshots in this guide use BEAT, a demo company in a Dynamics 365 test environment. Use your own company's codes and values instead of copying them.
When to run it
When to run it
Before you end production orders, to predict variances by comparing estimated with actual costs.
How often
On demand, for orders close to being ended or whose costs look unusual.
What the output shows
Estimated and actual cost and quantity per component item, routing operation and indirect cost of each production order. A large gap usually means consumption or route feedback is missing or was reported twice.
Nothing to undo: The report only compares cost figures; it changes nothing. Microsoft Learn
Technical architect
5Technical
Menu item
output:ProdCalcTransChecked in Dynamics 365
Form
SysOperationTemplateFormChecked in Dynamics 365
Roles to set it up and use it
To use itProduction manager ProdProductionManagerInventory accountant clerk InventCostCostClerkAccounting manager LedgerAccountingManagerInventory accountant InventCostAccountantGive people one of these roles. On this system, 4 roles can run this page.Checked in Dynamics 365