PAGE GUIDEWhat the page does and how to use it7 sections. Choose a role to highlight what matters to you.
Everyone
1What it is and why
What it is
A report that shows the hours, hour costs, item costs, and expenses posted on assets.
What you do here
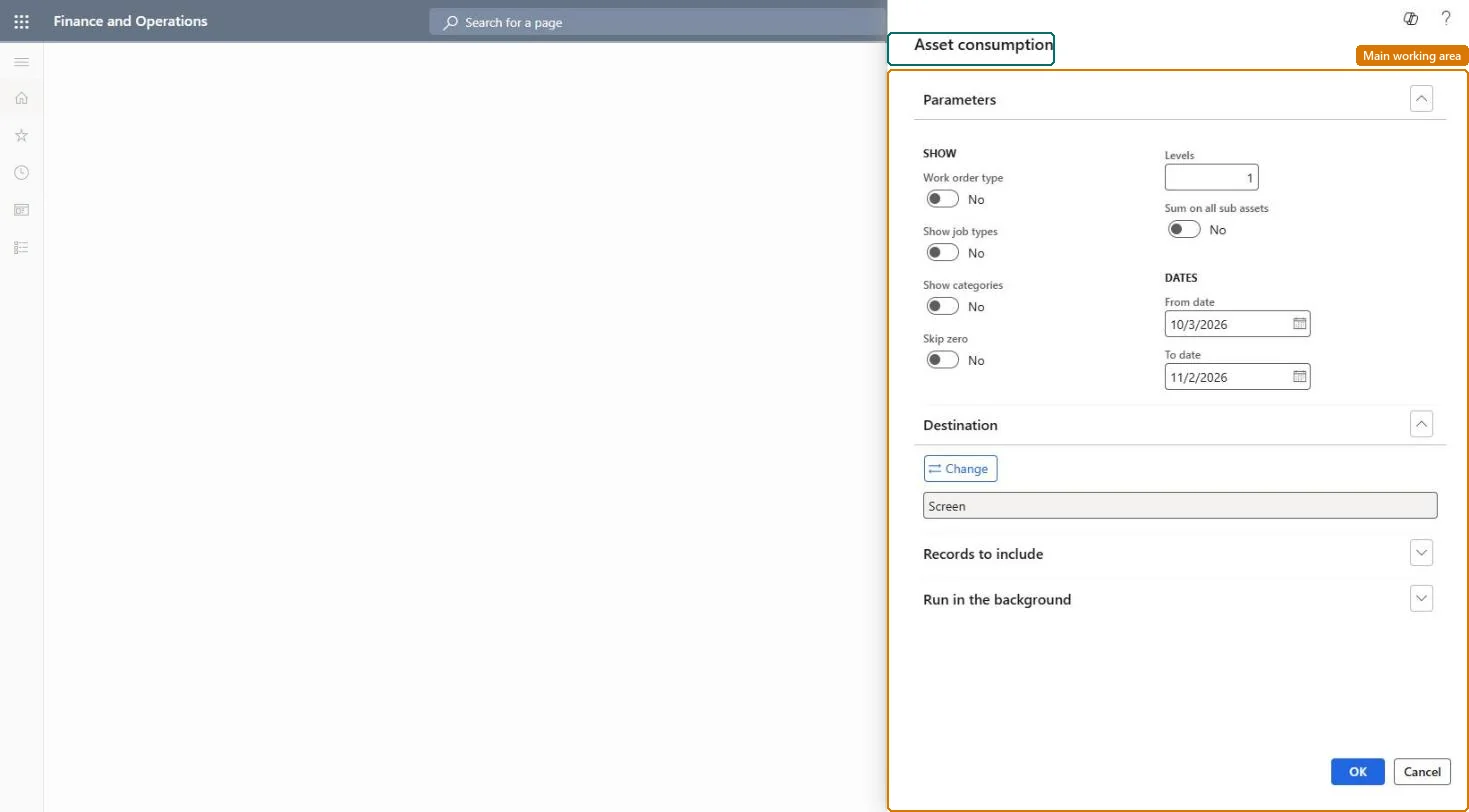
Use this page to print a consumption report for assets after consumption has been posted on work orders, for a date interval and at the functional location level you choose.
Example
For example, a maintenance manager sets Sum on all sub assets to Yes to see sums for each sub asset in the report.
The page in Dynamics 365. page title tab to open what to set or check
About the examples: Examples and screenshots in this guide use BEAT, a demo company in a Dynamics 365 test environment. Use your own company's codes and values instead of copying them.
When to run it
When to run it
After consumption has been posted on work orders, when you review maintenance cost per asset.
How often
On demand, for example at period end for maintenance cost reviews.
What the output shows
Hours, hour costs, item costs and expenses posted on assets in the date interval, by functional location level. Costs that are too low usually mean consumption hasn't been posted on the work orders yet.
Nothing to undo: The report only reads posted asset consumption; it changes nothing. Microsoft Learn
Technical architect
5Technical
Menu item
output:EntAssetObjectConsumptionChecked in Dynamics 365
Form
SysOperationTemplateFormChecked in Dynamics 365
Roles to set it up and use it
To use itMaintenance manager EntAssetMaintenanceManagerMaintenance clerk EntAssetMaintenanceClerkMaintenance worker EntAssetMaintenanceWorkerBudget manager BudgetBudgetManagerAuditor AuditPolicyManagerGive people one of these roles. On this system, 10 roles can run this page.Checked in Dynamics 365